Impact
Results
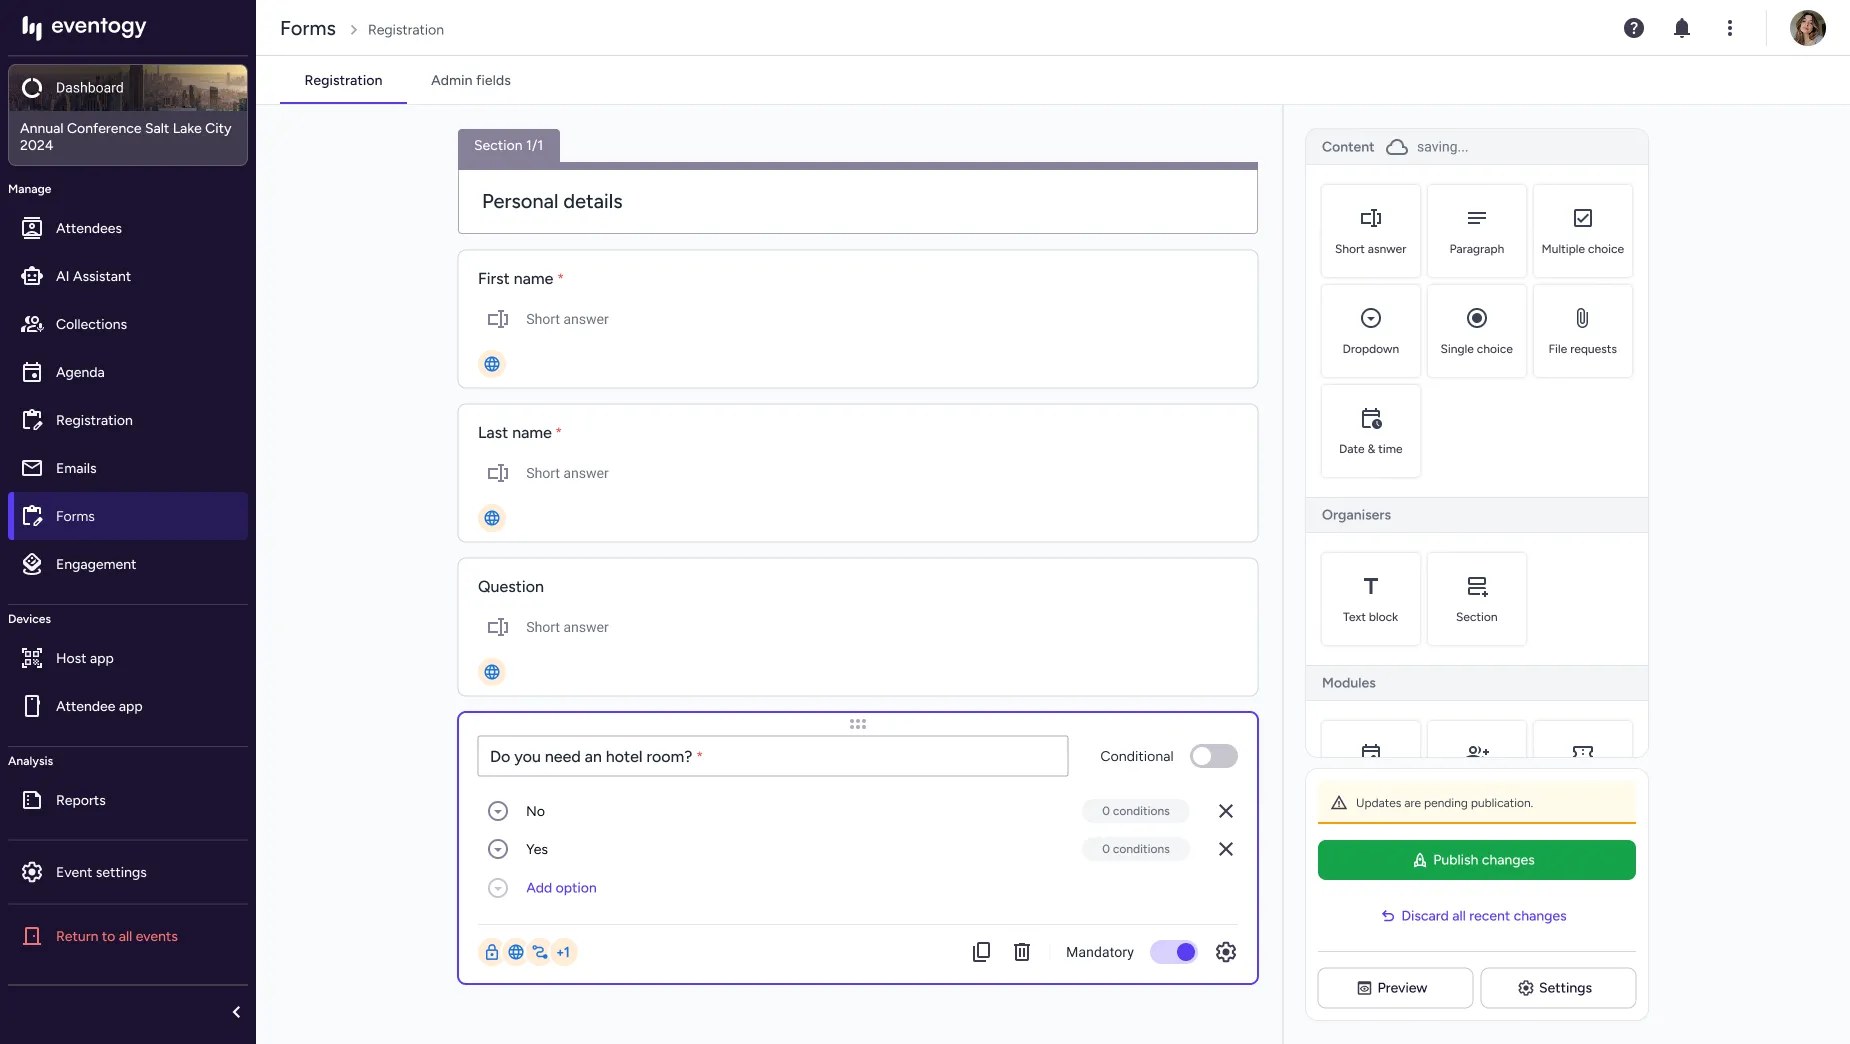
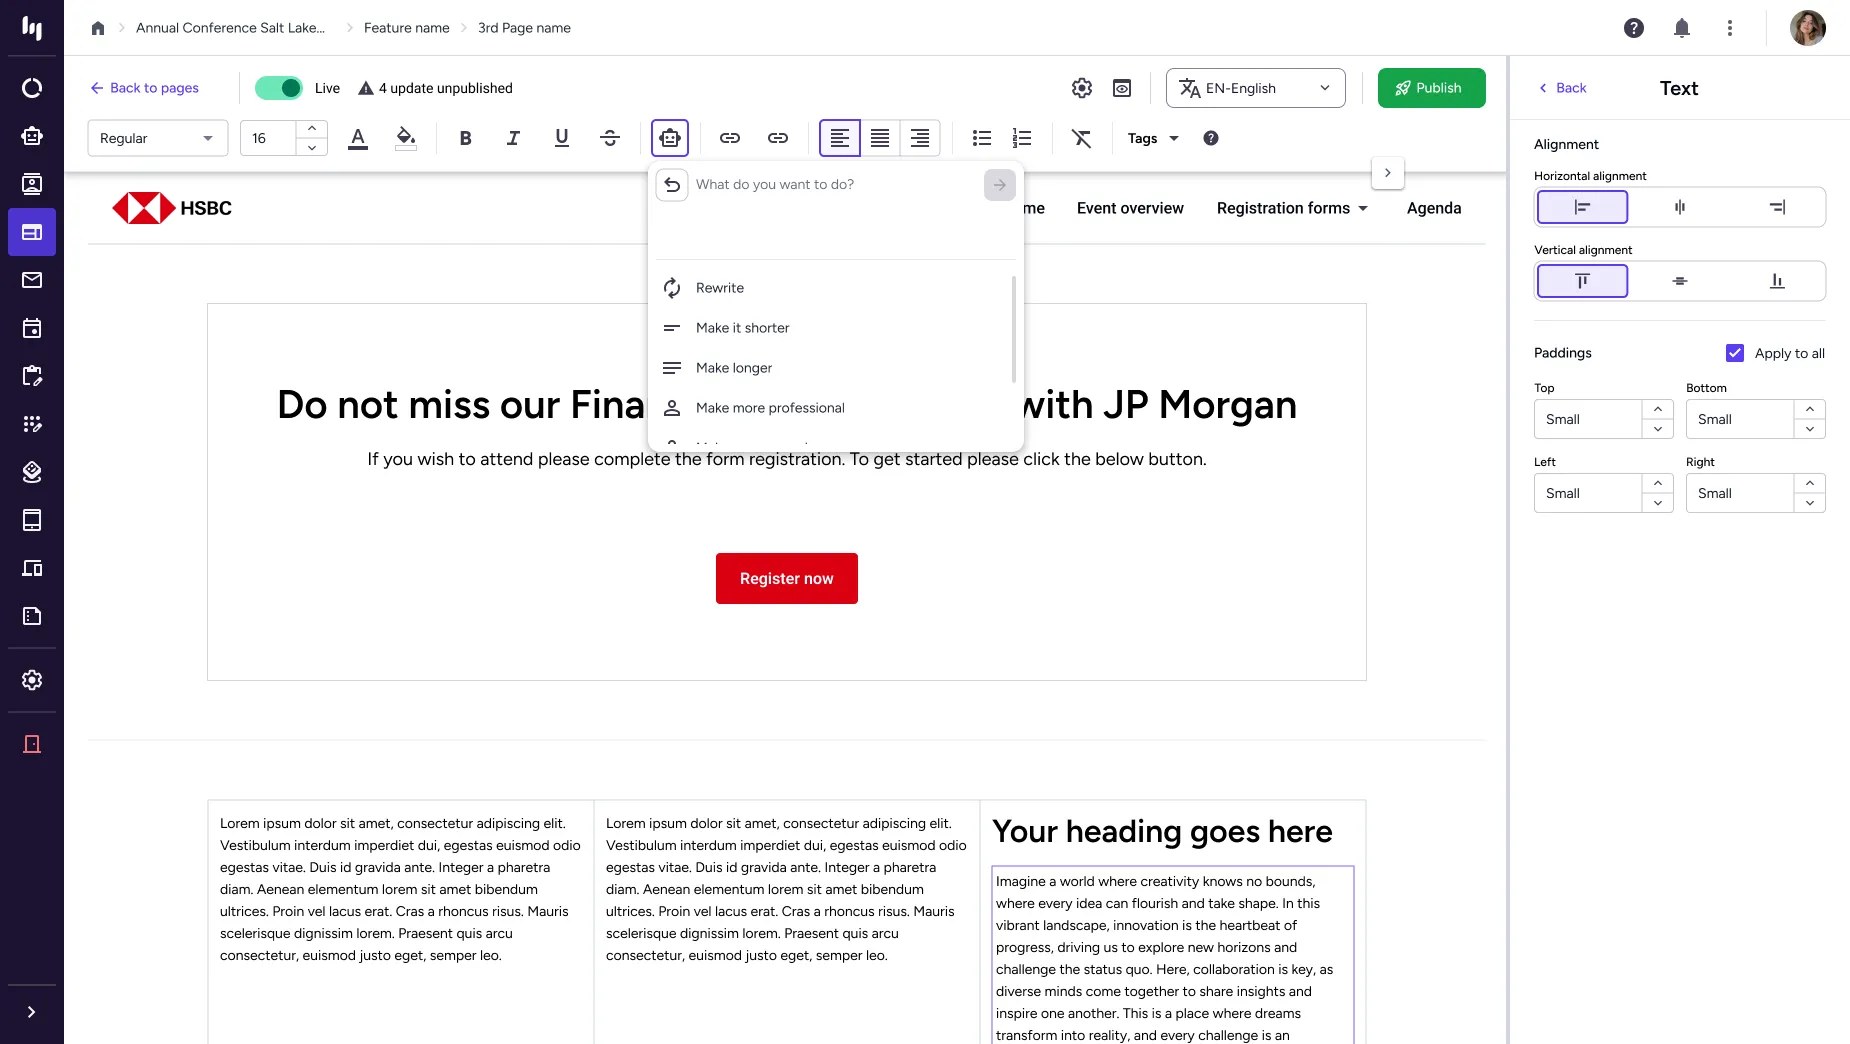
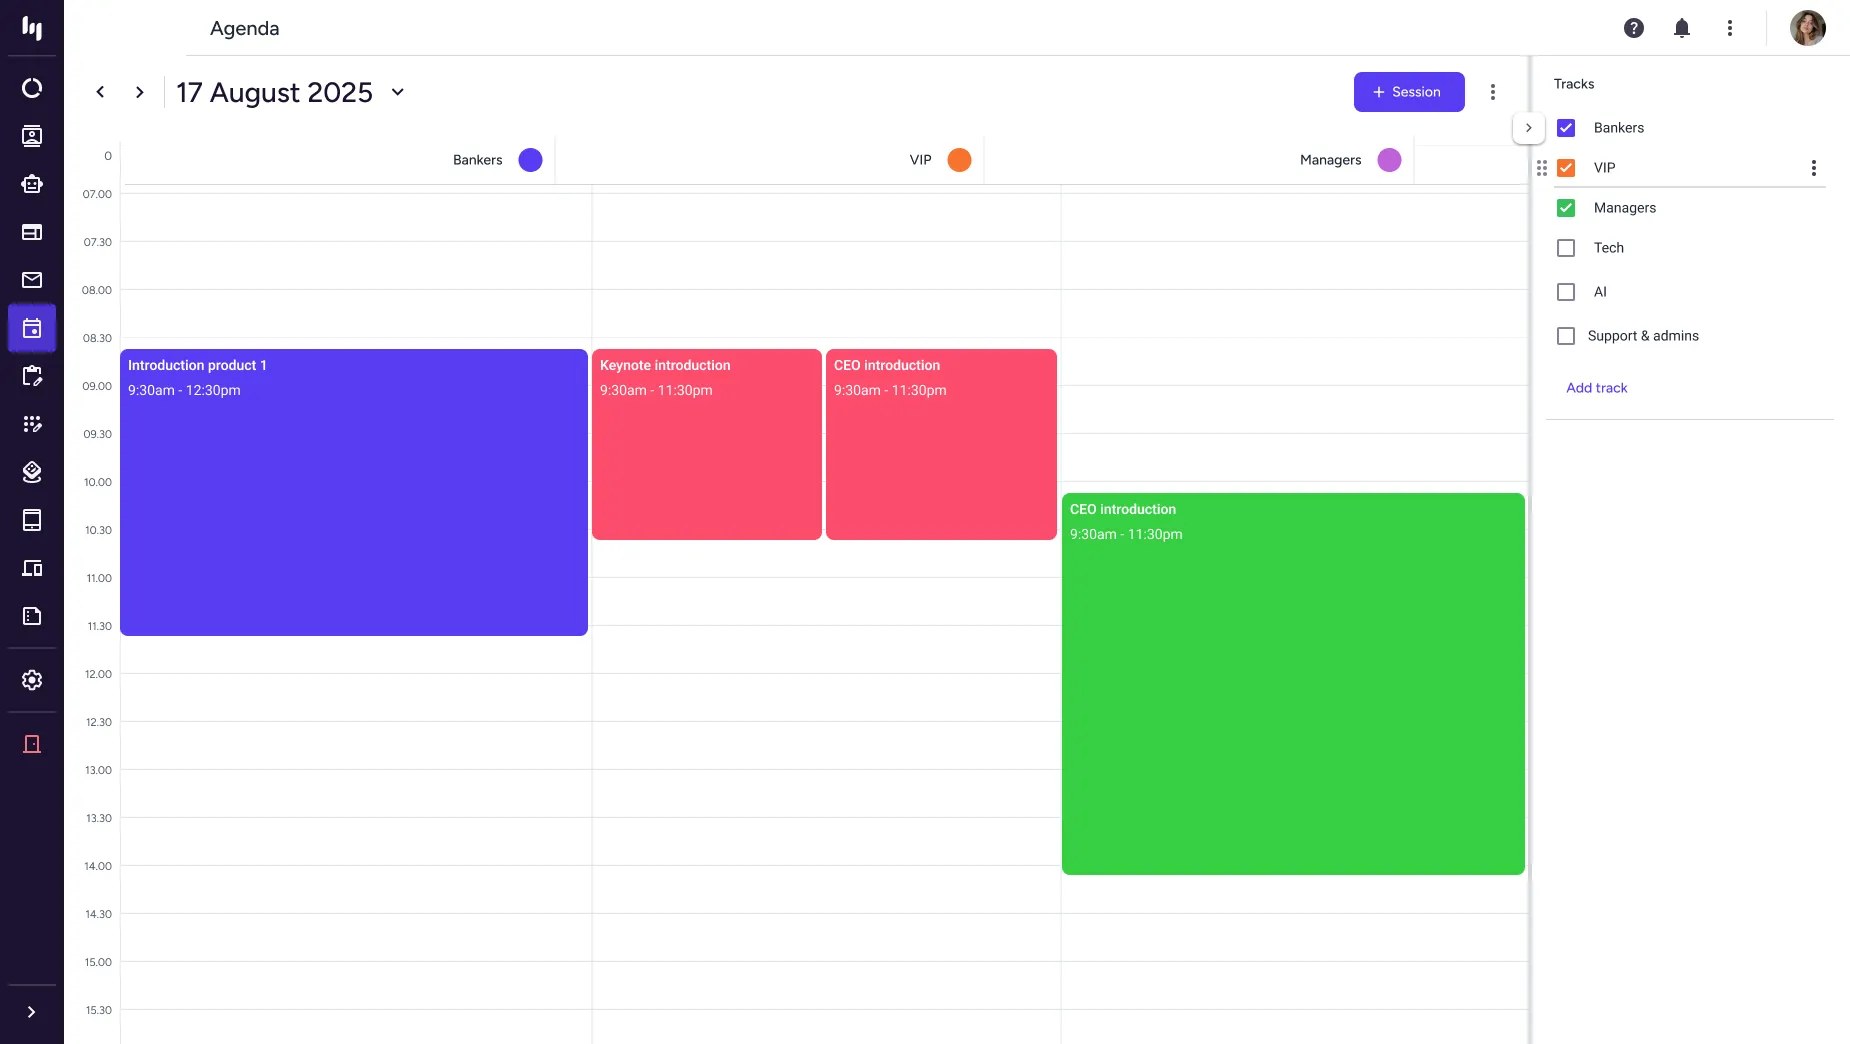
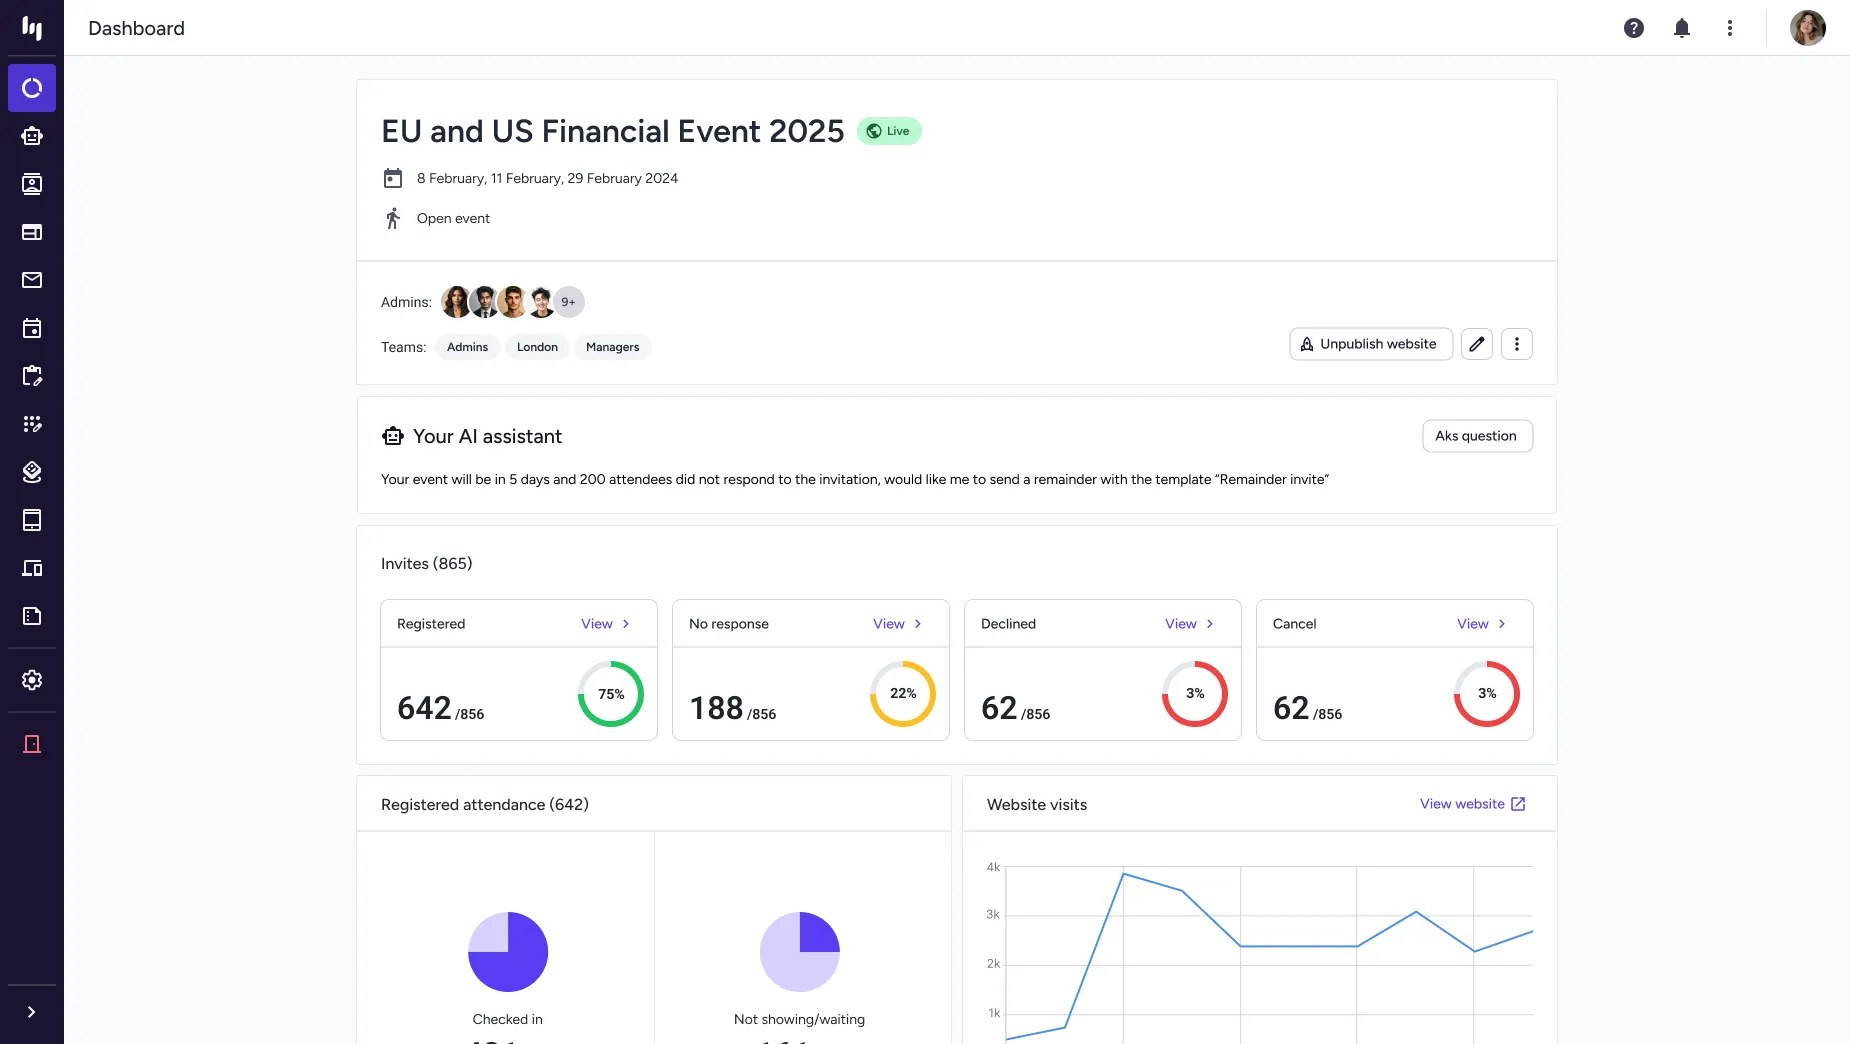
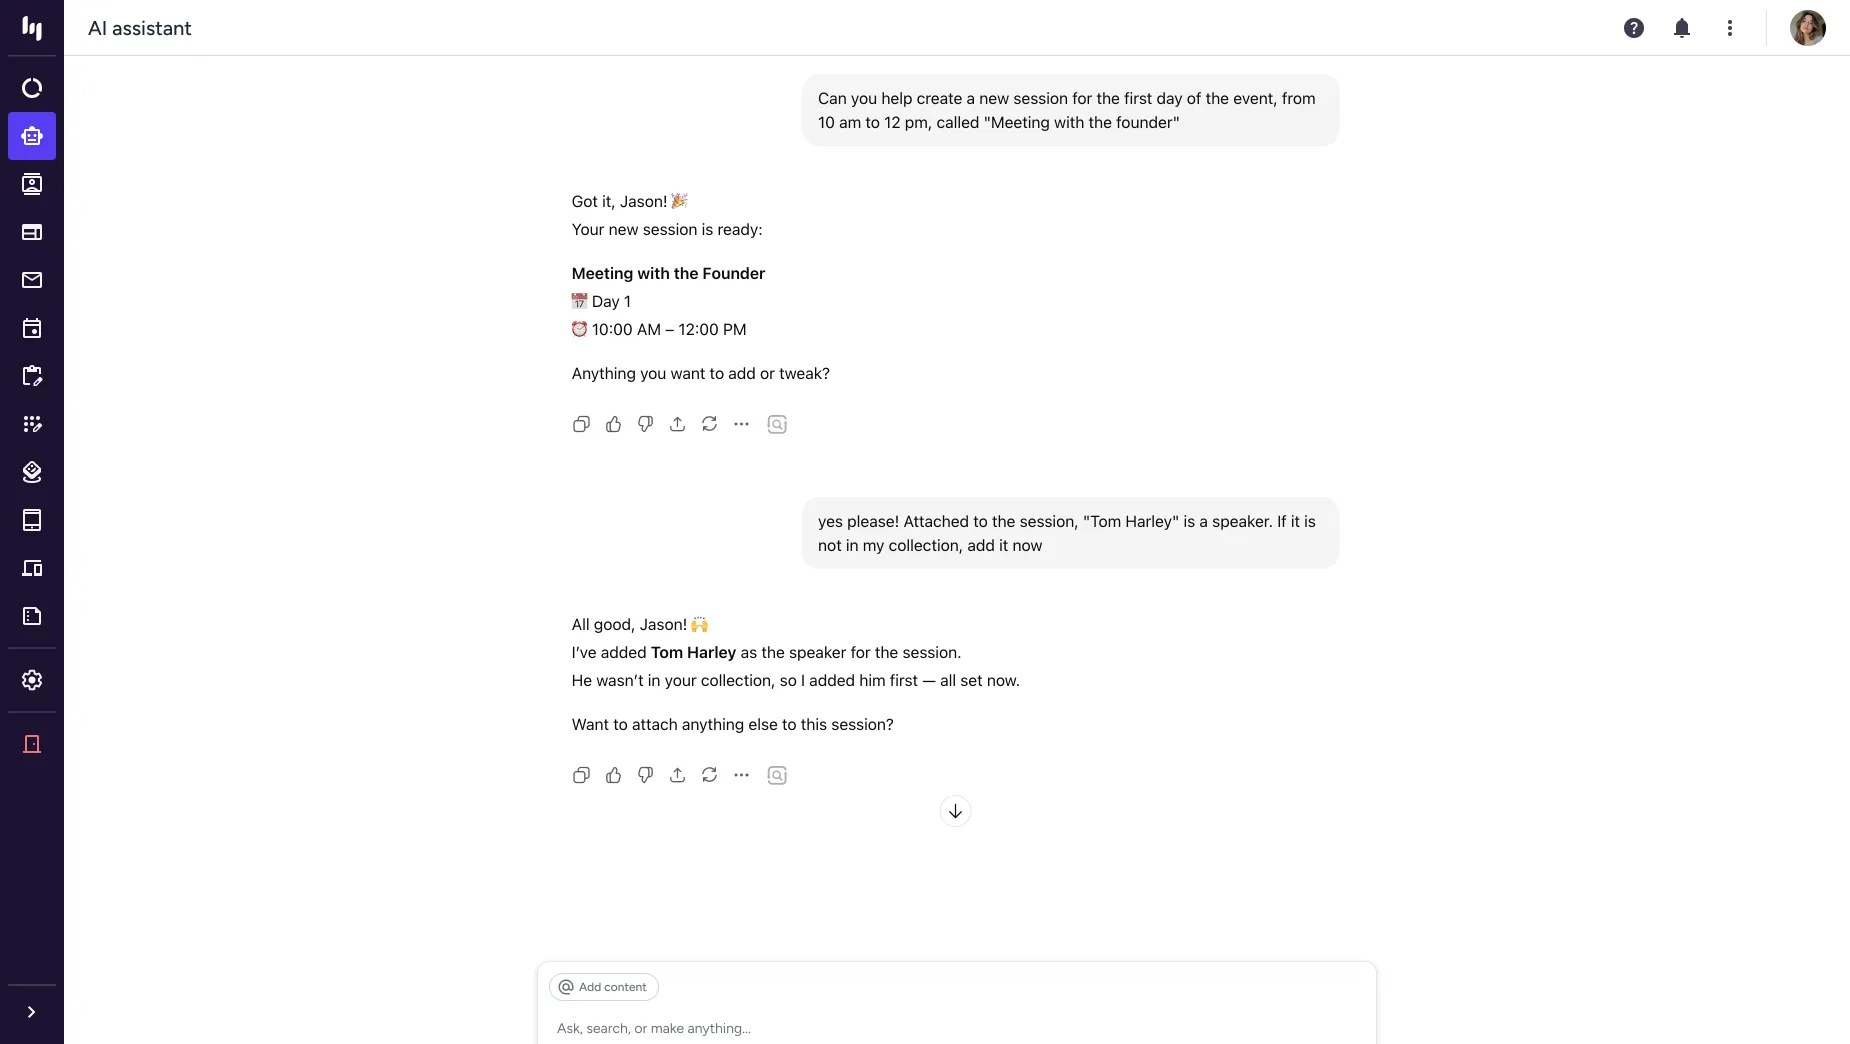
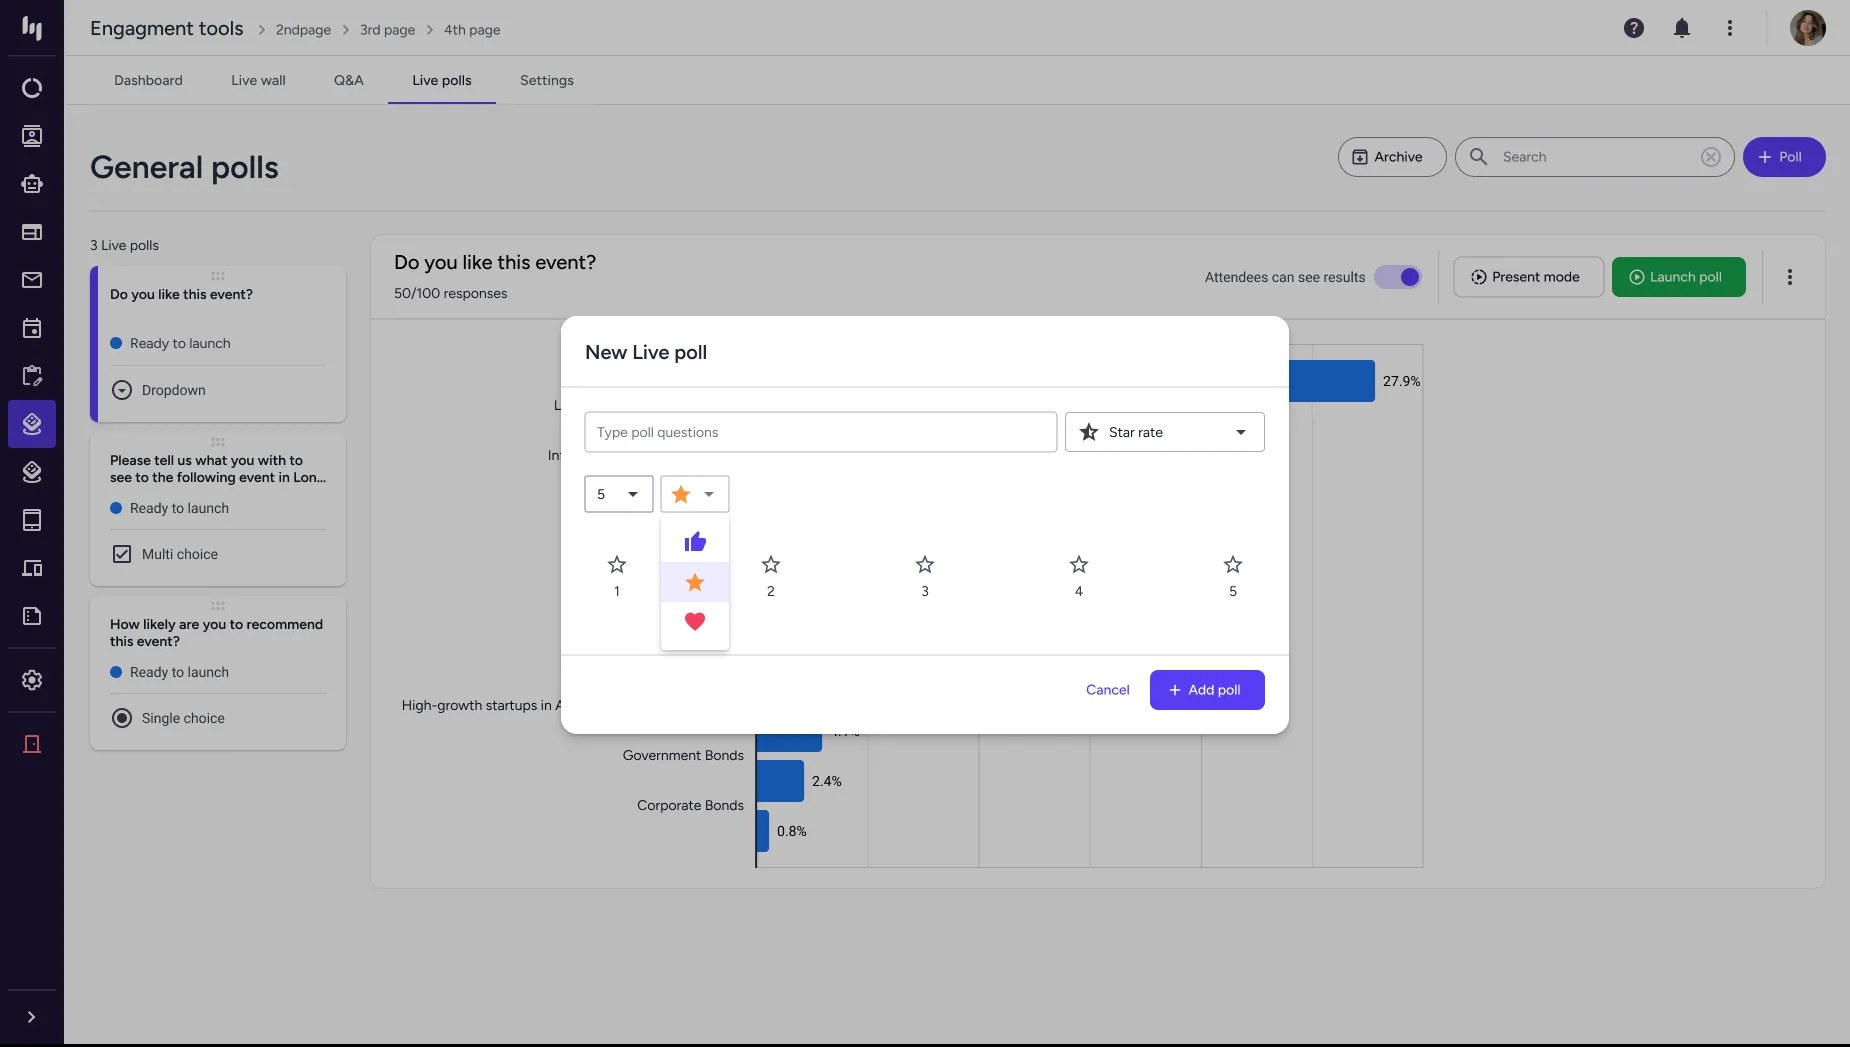
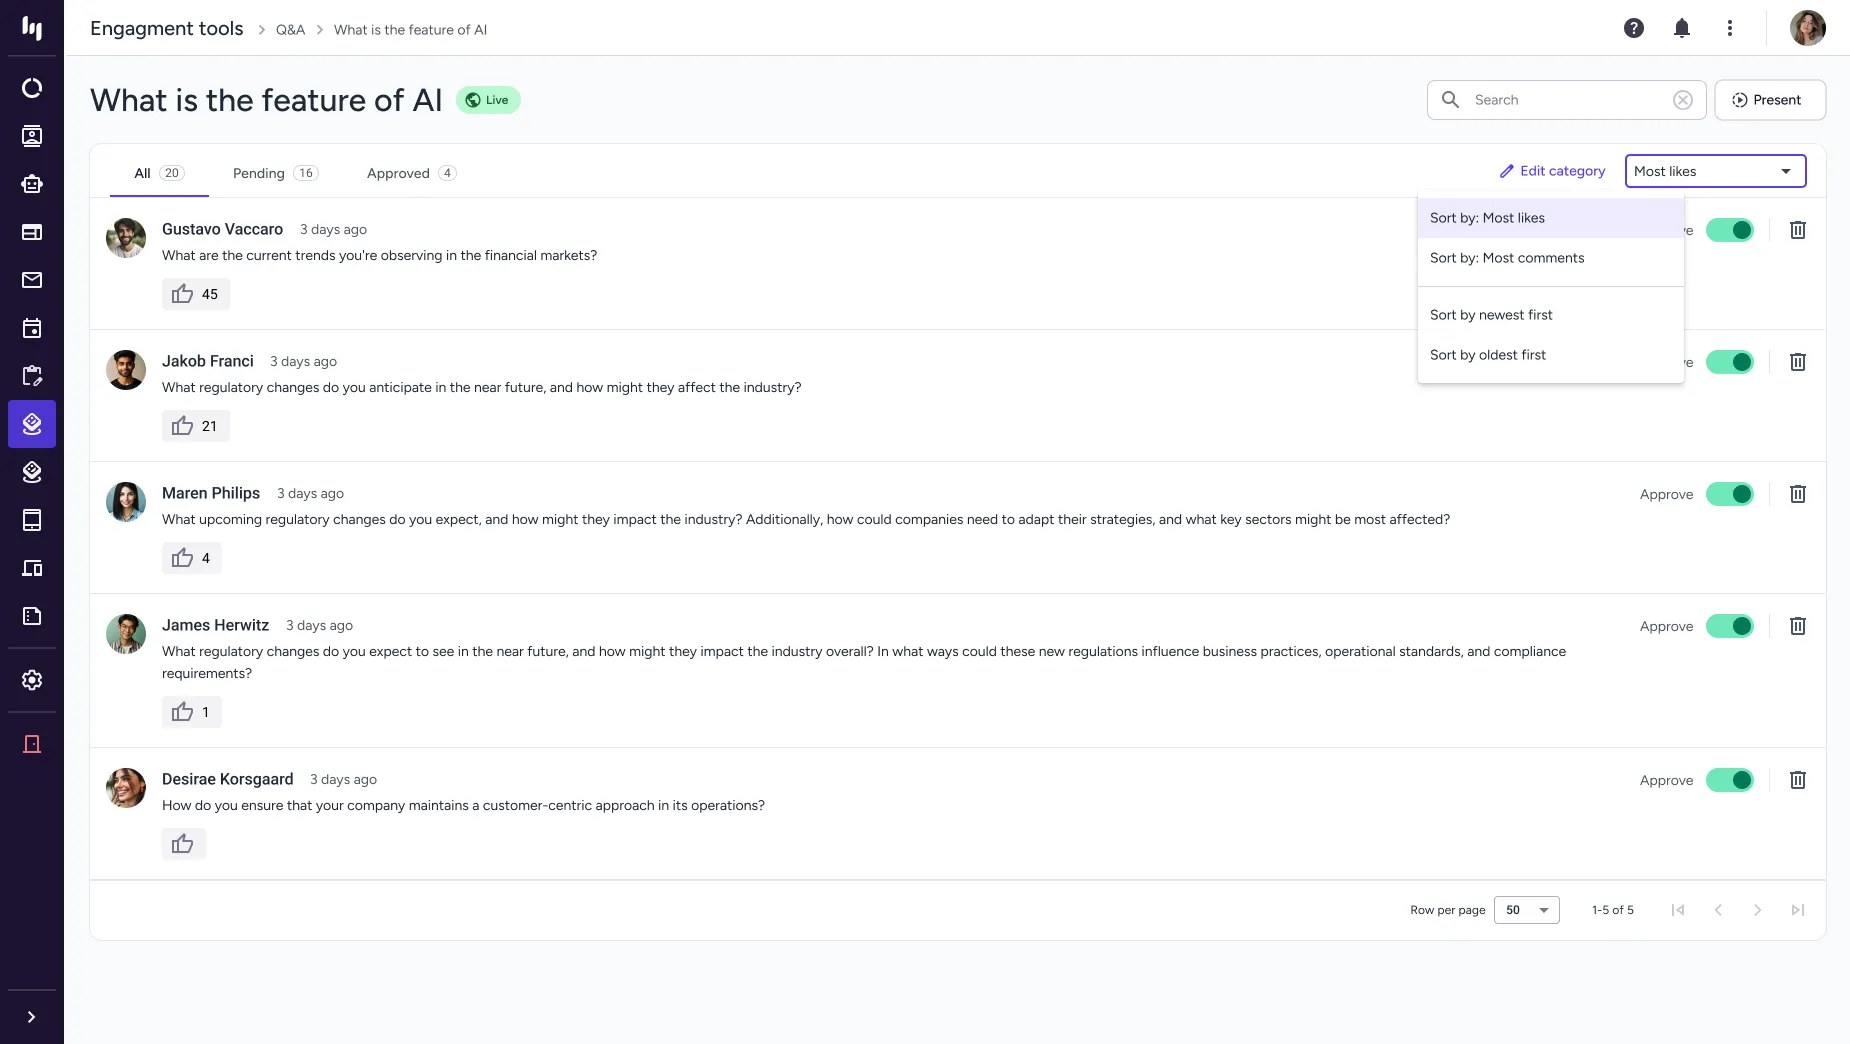
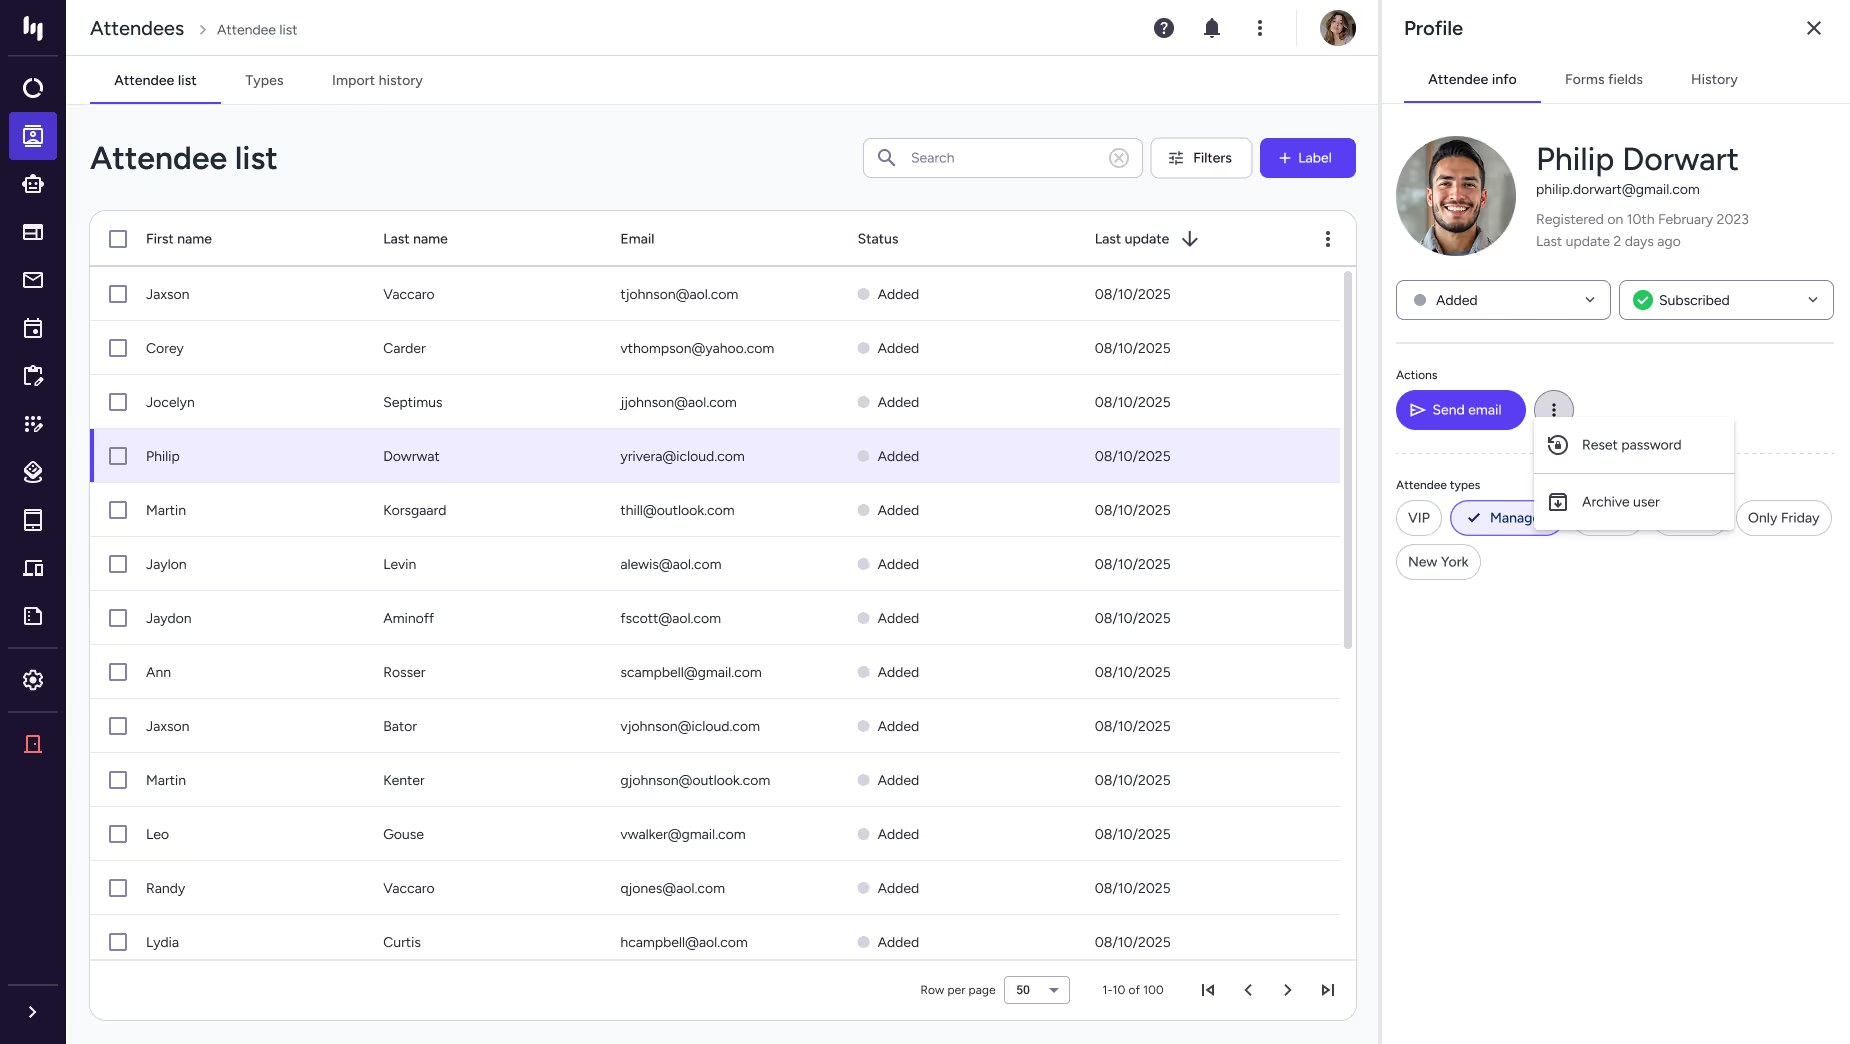
To evaluate the impact of the redesigned Eventogy platform, I used a set of standard, measurable UX and product metrics. These gave a clear view of how the new interface improved efficiency, reduced friction, and supported both users and the business.

Completion Time
- Before
- 35 min
- After
- under 15 min
Tracks time to create events or complete key workflows; average time dropped from 35 min to under 15.

Success Rate
- Before
- 10%
- After
- 80%
Measures error-free, unassisted task completion, which improved from 10% to 80%.

Error Rate
45%
Counts mistakes in key workflows, showing a 45% improvement in user reliability.

Support Tickets
−67%
Measures support requests tied to confusing interfaces or workflows, down by 67%.

Accessibility
- Before
- 45/100
- After
- 95/100
Automated audit score against WCAG, rising from 45/100 to 95/100.

Design System
- Before
- 35%
- After
- 88%
Alignment with the new design language, with design consistency increasing from 35% to 88%.

User Satisfaction
- Before
- 4/10
- After
- 8.5/10
Self-reported sentiment on the redesigned experience, improving from 4/10 to 8.5/10.
Designer-tracked metrics from this engagement, not a third-party study. Error rate, support tickets and satisfaction have no documented sample size or measurement window beyond "before vs. after launch"; the accessibility figure is an automated audit, not a full manual conformance review; design consistency is my own tracked measure. Two further figures (adoption and onboarding) were 1–5 ratings rather than the measures their labels implied, so they're left out.