
Case study · Primer
Payment Dashboard
Revamping the user experience for a seamless and intuitive interface.
- UI Design
- B2B
Overview
Improving buying experiences with dynamic dashboards
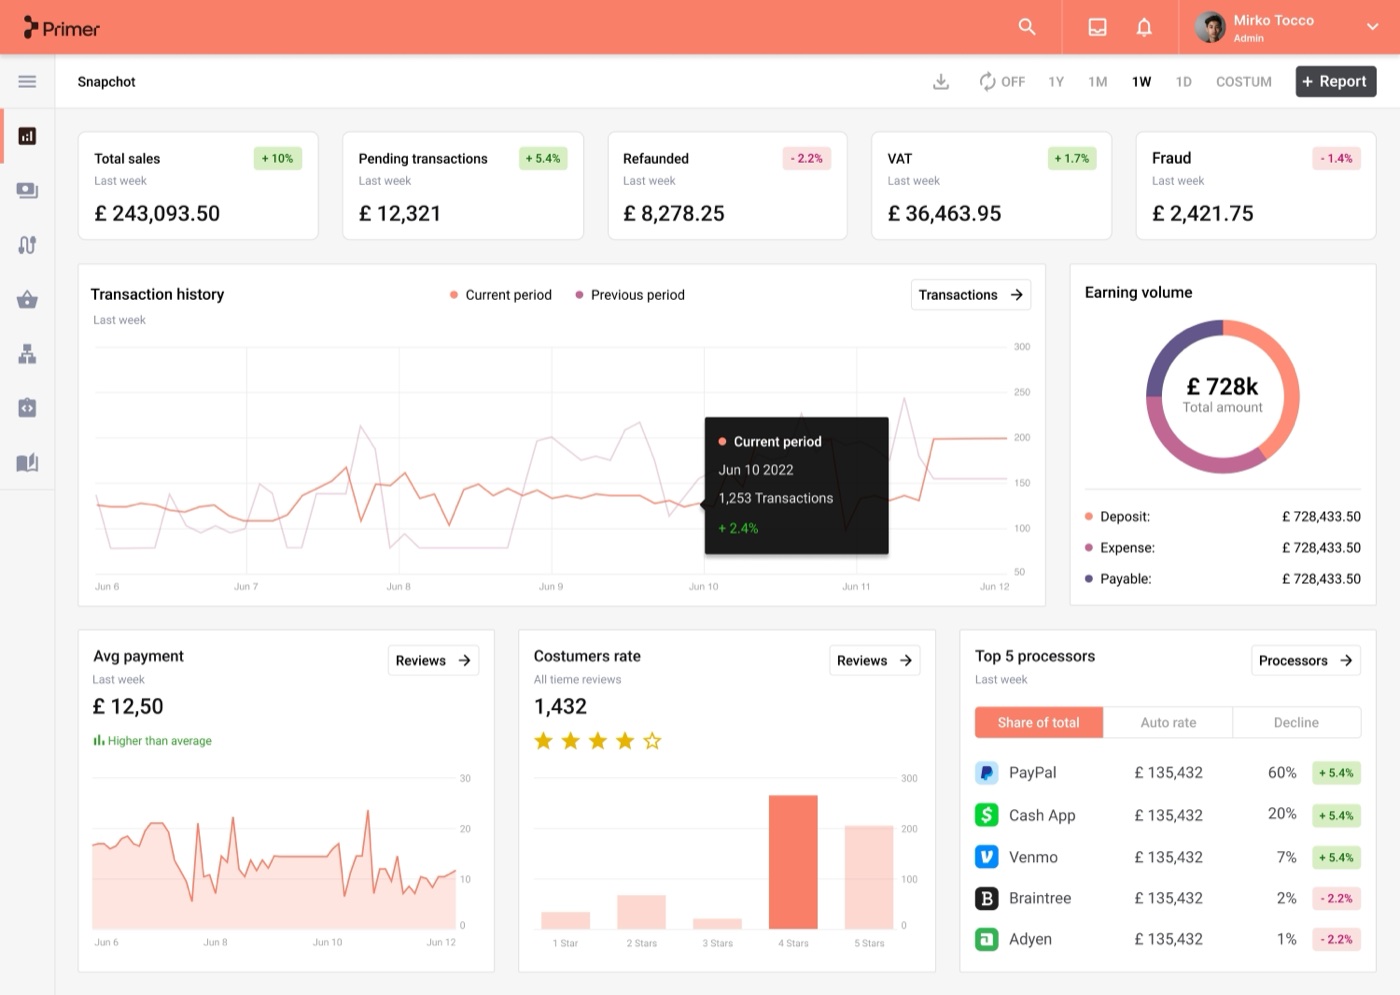
The challenge was to build the main dashboard screens, where insights and reports surface through data widgets, with the right charts, components and calls to action. Primer's users (merchants and developers) already have the underlying infrastructure and "lego blocks" of the Primer payment system, so they can build the best buying experiences for their own customers.

The challenge
Merchants struggle with using data for decisions
We needed a solution to make expense management easier.
-
A navigation system built for the future
Build a branded desktop navigation system that works for the future.
-
Dashboard screens that earn their place
Design dashboard screens for data insights and reports, with the right components and calls to action.
-

Tom, Admin User
A merchant who examines company expenses to improve cost management.
The user
Merchants don't always know which questions to ask
Presenting vital information clearly was the key task. With the redesigned dashboard, merchants can act on insights from data promptly: turning payment data into action is just a click away.
- Simplify vital information display.
- Enable swift merchant response to data.
- Streamline payment overview.
Design
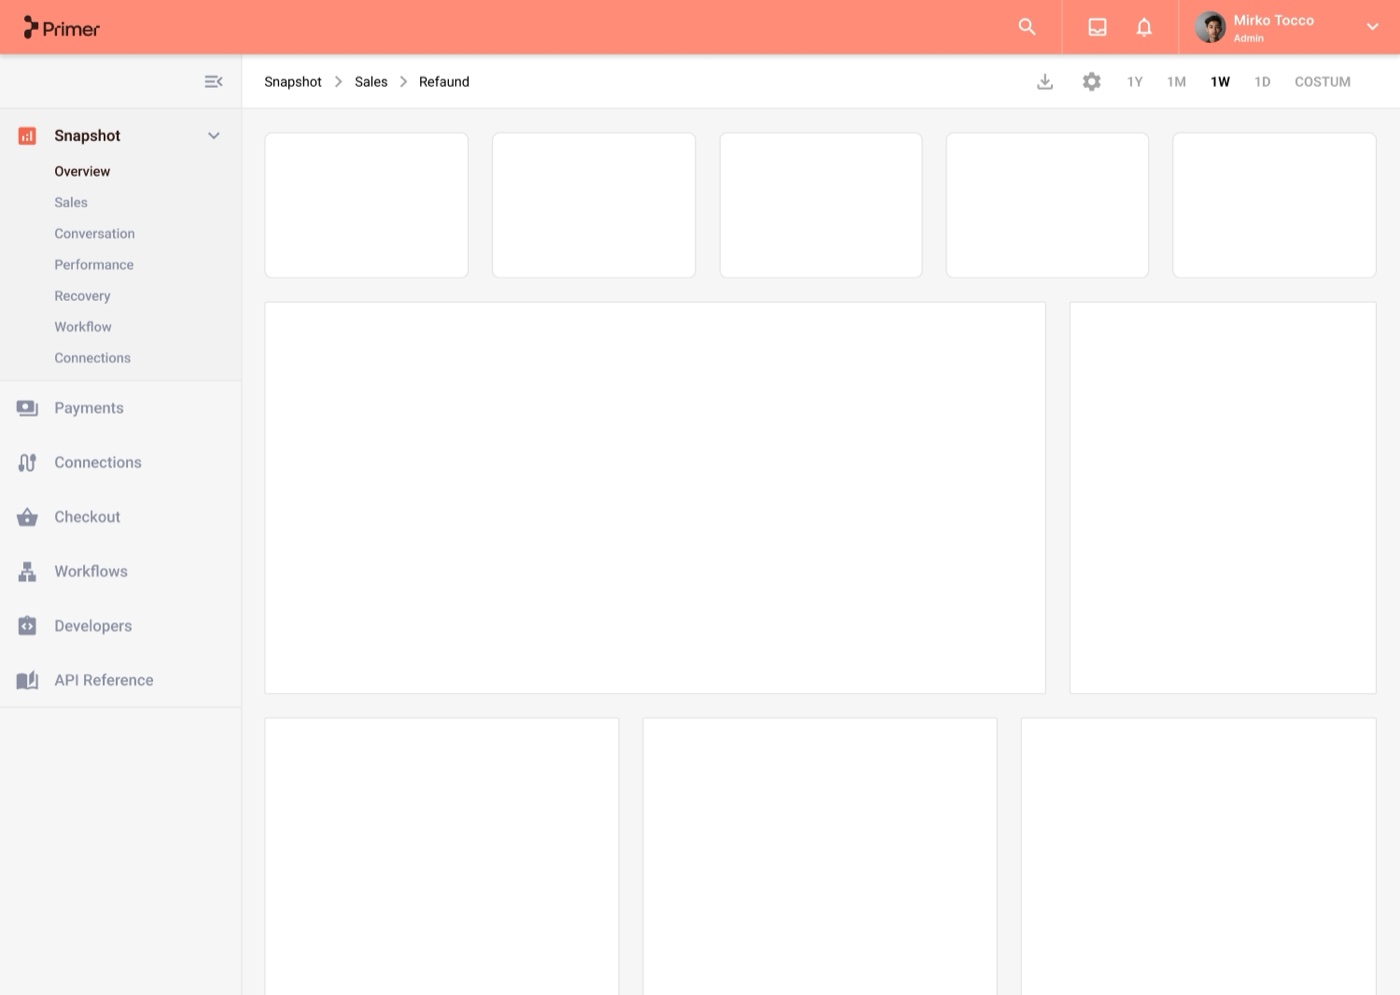
Nav system
A scalable solution for managing a large number of features through a left navigation bar, giving quick access to every section of the dashboard.
Design
Dashboard overview
The overview screen is designed to be responsive across desktop, mobile and tablet. The Admin user can navigate straight to a specific section to get more detailed information.
Design
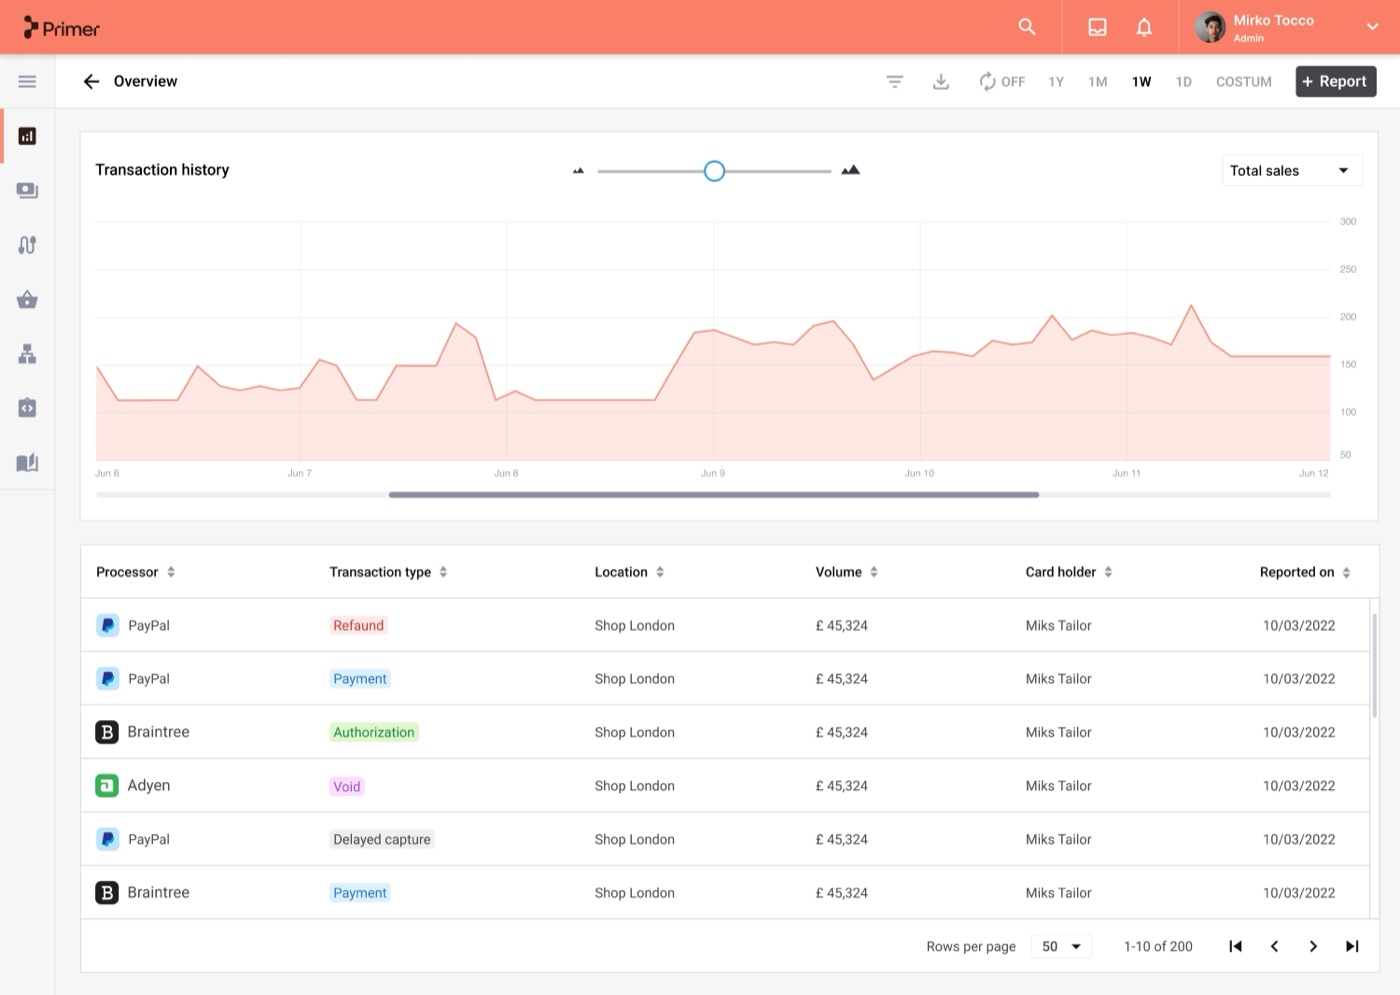
Transaction history
Reached by clicking "Transactions" in the History section, this screen lets users dig into detailed reports and investigate their transaction data further.
Portfolio
Explore additional projects
Next
Building something similar?
I help teams turn scattered products into systems people can actually use, from research through to a design system developers can build from.